Process raw DTI data in DTI Studio
Written by Owen Phillips. Email Dr. Katherine Narr if you have any questions. This protocol explains how to process raw Siemens Dicom data in DTIStudio. For more information on identifying white matter tracts using DTIStudio, see http://narr.bmap.ucla.edu/protocols/.
Note: Tractography shown in this protocol was performed in DTIStudio using 30 direction diffusion data.
- Open DTI Studio.
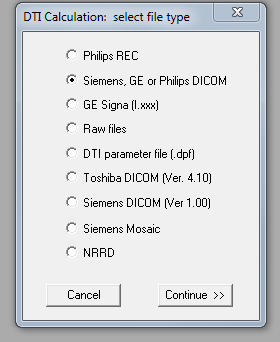
- Go to File, and select DTI Mapping. Select "Siemens, GE or Philips DICOM".

- For DTI parameters select. Slice orientation = Axial. Slice Sequencing = Inferior-superior, Slices to be processed = All Slices, b_value = 1000. Copy and paste in the following Gradient Table:
1:0,0,0
2:0,0,0
3:0,0,0
4:0,0,0
5:0,0,0
6:-1,0,0
7:-0.166,0.9862,0
8:0.11,0.6639,0.7398
9:-0.9012,-0.4191,-0.11
10:0.1691,-0.601,0.7812
11: 0.8148,-0.3858,0.4329
12:-0.656,0.3661,0.6601
13:-0.5822,0.8004,0.1431
14:-0.9001,0.2591,0.3501
15:-0.6932,-0.6983,0.1781
16:-0.3568,-0.9236,-0.1399
17:-0.5431,-0.4881,-0.6831
18:0.5252,-0.3961,0.7533
19:0.6393,0.6893,0.3412
20:0.33,-0.0129,-0.9439
21:0.5241,-0.783,0.3351
22:-0.6087,-0.0649,-0.7906
23:-0.22,-0.233,-0.9472
24:0.004,-0.9098,-0.4149
25:0.5108,0.6267,-0.5886
26:-0.4138,0.7368,0.5348
27:0.679,0.139,-0.7209
28:-0.8839,-0.2959,0.362
29:-0.2619,0.432,0.863
30:-0.0879,0.185,-0.9787
31:-0.2939,-0.9068,0.302
32:-0.887,-0.089,-0.453
33:-0.2569,-0.4429,0.859
34:-0.0859,0.867,-0.4909
35:-0.8632,0.5042,-0.026
Select "Dicom Image-Files Folder" - This will be your raw Dicom DTI data. Select file "1". DTIStudio will read in all the files even though you have only selected the first.

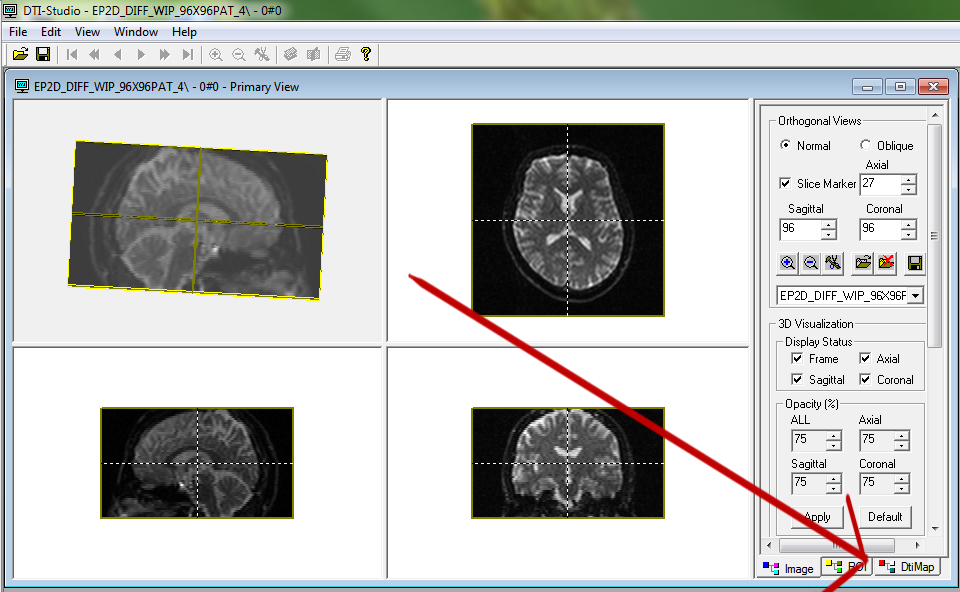
- Click on DtiMap

- Select "Calculation - Tensor, Color Map etc. The default settings will be set and should be used but they are as follows: Create a mask-image based on the background noise level: 10 Consider B-Value Use the mean B0 of all scans for DTI calculation (default) Standard SVD method for LMS equation (default).

Click "Ok".
- You will get a prompt "Automatic Outlier Rejection?" Click Yes.
- You will get a prompt "DTI-Map Options: Automatic Outlier Rejection. Keep the default settings.
Tensot quality feature: Regular difference between the Fitting and the Original images, Criterior to judge a bad image: Auto-correlation: 2-pixels lag - Threshold: 2.2, Action on the bad images in each iteration: Reject the worst one. Verify the result: For the iteration 1.

- Click on Fiber Tracking.

- You will get a prompt: "Fiber-Tracking Parameters". Set "Start Tracking if Fractional Anisotropy > 0.2 and Stop Tracking if Fractional Anisotropy < 0.2 if Tract turning angle > 70.

- Click on the Image Tab down at the bottom Right of the Program. Click on Image Processing - Color Map. Select Eigen Vector - 0 and Anisotropy - FA. Click Ok.

- Click the bottom right tab - Fiber. Select the following options on the right hand command panel. Fiber Display = Selected, show fibers on 2D image. Fiber Selection = ROI - Drawing Enable. Fiber Color = Random. ROI - Shape = Free. ROI Operation = or.

- Identify the Arcuate Fasciculus.


